-
12-15-21 Media Only News Briefing: Predictive modeling for COVID in preparation for the holiday travel season
Share this:


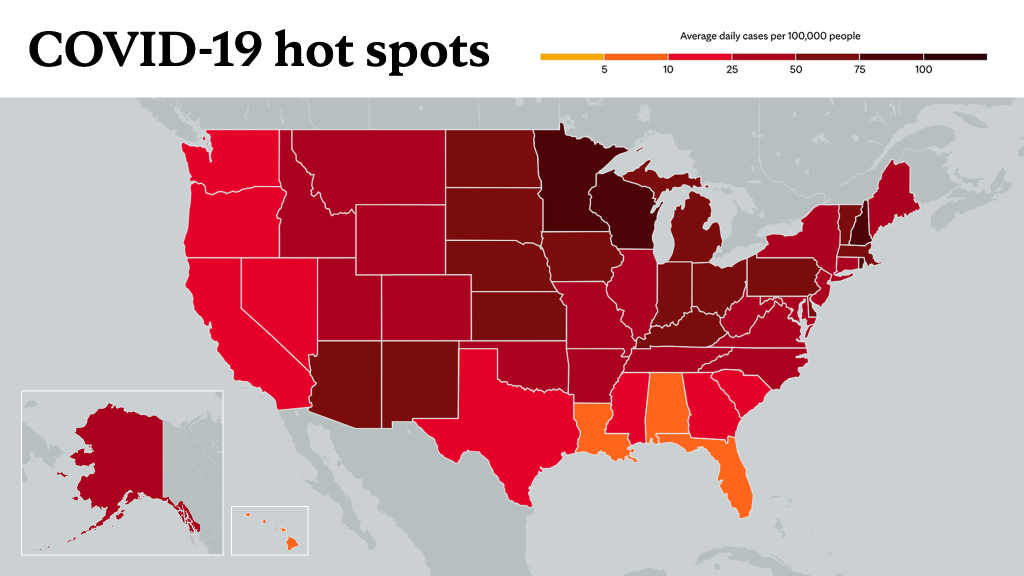
On Wednesday, December 15, Dr. Shannon Dunlay, M.D., co-leader of Mayo Clinic's COVID-19 modeling team, and Curtis Storlie, Ph.D., a Mayo Clinic data scientist, fielded questions around Mayo's Coronavirus map tracking tool, which has county-by-county information on COVID-19 cases and trends nationwide. The tool can help show what the risk is now and how it is changing. It offers predictive modeling and forecasts where hot spots will emerge. What do the COVID-19 map trends mean for people considering holiday gatherings or travel?
Journalists who have already registered on the News Network can log into their accounts to download a recording of the Zoom briefing found at the end of this post.
Journalists who would like to access the media briefing video can register with the News Network here.
For the safety of its patients, staff and visitors, Mayo Clinic has strict masking policies in place. Anyone shown without a mask was either recorded prior to COVID-19 or recorded in a nonpatient care area where social distancing and other safety protocols were followed.
Information in this post was accurate at the time of its posting. Due to the fluid nature of the COVID-19 pandemic, scientific understanding, along with guidelines and recommendations, may have changed since the original publication date.
For more information and all your COVID-19 coverage, go to the Mayo Clinic News Network and mayoclinic.org.
Learn more about tracking COVID-19 and COVID-19 trends.