-
Research
Discovery’s Edge: Before the Bone Breaks
“People were still getting fractures.”
That was the problem faced by Sundeep Khosla, M.D., Mayo Clinic endocrinologist and osteoporosis expert. He and his team were troubled. Patients without a diagnosis of osteoporosis were arriving at the clinic with unexplained hip and spine fractures.

Osteoporosis is a chronic disease that causes gradual bone weakening. Low bone density is one factor used to identify osteoporosis, and the gold standard measurement for bone density is the dual X-ray absorptiometry (DXA) scan.
“A low DXA score, below a certain level, is defined as osteoporosis,” Dr. Khosla explains. “But for patients not quite in that zone but still at risk, DXA doesn’t pick them up. We needed a better identification method for fracture risk.”
The day a patient is diagnosed with osteoporosis is not the day that patient became ill. The disease process occurs over time, and presents a complex picture. Researchers have to determine how age, gender, and other diseases may affect bone remodeling. But to gather that information, they need comprehensive data that spans years.
Dr. Khosla had access to long-term patient data, but what he needed was a new and innovative way to assess fracture risk.
New Tech, New Partnership
“If you look at what Sundeep has done over the years,” says Tony Keaveny, Ph.D., biomechanical engineer and director of the Berkeley Orthopedic Biomechanics Laboratory at the University of California, “he successfully reaches out to those in the field who have new and interesting techniques that he could possibly apply to his ongoing studies.”

And Dr. Keaveny was experimenting with an interesting technique called finite element analysis (FEA).
FEA is used by engineers to build bridges and cars, but it is flexible enough to use for modeling the stress on medical devices — and bones. With FEA, engineers build a virtual model using an image of a structure. The image is divided into different regions based on its geometry and material characteristics. Material properties are assigned to these different regions, and virtual forces are applied to create a virtual model of the overall structure. Computational techniques then calculate the overall strength, using principles of classical mechanics. Using this approach, engineers can gather structural information for each region of the model and for the object as a whole.
“We started applying it to modeling bones well over 20 years ago and developed some very detailed models,” says Dr. Keaveny. “Other groups were doing the same thing but then we found that a somewhat simplified version of the approach, one that could be derived from clinical images, worked very well.”
Which was a bit of a surprise, Dr. Keaveny admitted.
After detailed modeling using cadaver bones, Dr. Keaveny presented and published the findings. Then he started to think about clinical implementation. “I got the itch to do some engineering, to make something that people can use,” he said. “When we saw the computer modeling and saw its clinical potential I went after that.” Because an engineering department is not set up to handle patient data, Dr. Keaveny founded the company O.N. Diagnostics to handle clinical investigation. With this structure in place, the collaboration with Dr. Khosla became more serious.
When Dr. Khosla talks about FEA, he uses the analogy of a bridge. “You can make a bridge in many different ways,” he explains. “Using DXA is like putting a bag over it and getting an average of the amount of steel within the area of the bag. But with FEA you can see the actual structure and determine the amount of weight the bridge will hold.”
In this way, FEA can provide bone density measurement and also act as a virtual stress test on the bone. Researchers use CT scans, image processing, and the FEA analysis, to load the bone with virtual force until it breaks.

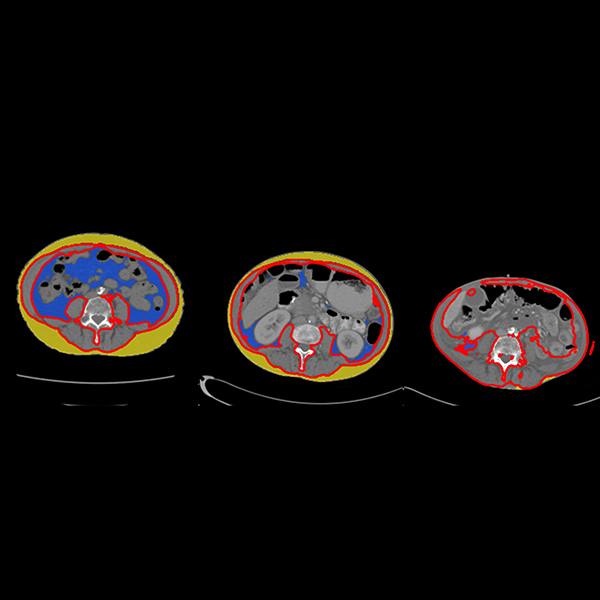
Reprinted by permission from Macmillan Publishers Ltd: The American Journal of Gastroenterology, Weber et al., 2014; volume 109: pages 401-8. (Figure 1)
“The actual force that occurs during an impact that fractures a person’s bone will vary a lot across different people and different fracturing events,” says Dr. Keaveny. “Rather than try to account for all the different ways a person can fall and fracture, which is very difficult to do accurately, we apply a standardized test that tells you what the patient’s bone strength should be under a specific fracturing event. The resulting ‘virtual measurement’ of bone strength is similar to what you would measure in a standardized laboratory test, and can be used clinically to predict a risk of fracture.”
After informal discussions at workshops and meetings, Drs. Khosla and Keaveny began discussing how to test FEA in a clinical setting. “Mayo Clinic has an unparalleled structure for clinical research, including access to data from the Rochester Epidemiological Project,” says Dr. Khosla. The Project is a medical collaboration between southeastern Minnesota healthcare providers. This 50-year-old consortium collects medical data from participating patients. “There is nothing like this in the United States and likely nothing this detailed in the world,” said Dr. Khosla.
Clinical Questions, Clinical Results
Both investigators applied for and received federal funding, including joint grants. In the first study, postmenopausal women with a history of spinal, or vertebral, bone fractures were recruited and compared to a control group of similar ages. The scientists examined bone variables to tease out differences between the groups. They focused especially on the low end of the vertebral fracture severity scale, called grade 1 deformities.
The researchers found that FEA-measured virtual-compression strength decreases among all grades of fracture. They also reported that strength estimates differ for different types of bone, an important detail not captured by DXA. And using FEA, the data showed that load-to-strength ratios of patients differed from the control group.
Two factors are assessed in the load-to-strength ratio. Load is the patient-specific force that acts on the patient’s vertebra during a compressive overload. Strength is the FEA-estimated strength of the bone.
When the load-to-strength ratio is greater than or equal to one, a fracture may be more likely. Using FEA analysis, the authors simulated the force of movements, such as bending forward. They found that the load-to-strength ratio increased across all the patients. Of course in real life each person moves, bends, and lifts objects differently. “This cannot simulate you picking up groceries,” explains Dr. Keaveny. “We all pick up groceries differently.” But this standardized type of virtual overload did show that this analysis provides greater detail on bone variables, which could lead to better interventions.
In 2012, the Food and Drug Administration deemed the FEA software to be “substantially equivalent” to structural measurements as provided by DXA, and its bone density measurements to be equivalent to those from DXA. FEA was on its way to clinical implementation, but there were challenges. “When you are doing this on patients there are variations in the CT scan settings, the machines themselves, and the operators,” explains Dr. Keaveny.
And then there was the phantom.
Improving the Scan
When using CT scans for bone mineral density, patients lay on a plastic plate, called a calibration phantom. Imbedded in the plate are chambers of standardized materials with known bone-equivalent densities. When the body is scanned, these materials show up as gray-scale values of various intensity and serve as references with which to calibrate the gray-scale values in the remainder of the scan. In that way, one can quantitatively measure bone density from the gray-scale values in the scan.
“But was the calibration phantom really necessary?” wondered Dr. Keaveny. He began working on a way to use a patient’s internal tissues to serve as reference materials with which to calibrate the scan. “That would enable you to apply the FEA analysis technique to a CT scan already taken,” said Dr. Keaveny. “We call this opportunistic analysis. You don’t order up the CT scan to test the bone; instead you seize the opportunity to exploit an already-taken CT.”
Fewer scans that provided more information than DXA and took less of patients’ time?
“That was the key innovation,” said Dr. Khosla.
Ripples of Clinical Innovation
“We did not have a grand plan,” said Dr. Keaveny. “We just kept talking and it was very organic the way it went on.” With cutting edge engineering expertise provided by Dr. Keaveny’s team and the deep medical expertise from the Mayo Clinic physicians and researchers, the collaboration was mutually beneficial. But it was the Mayo Clinic team science culture that allowed for the original collaboration to expand, according to Dr. Khosla.
“Historically I have tried to take advantage of innovation both with Mayo Clinic colleagues and collaborators outside of Mayo,” he said. “What’s always been a Mayo Clinic strength is understanding clinical problems, and using new approaches to see if they fix clinical problems.”
In the case of FEA for bone fracture risk, it took about a decade.
Freed to use any CT scan, the collaboration expanded to other patient groups in need of bone assessment. For example, patients with inflammatory bowel disease (IBD) are at higher risk for osteoporosis than the general population. Active inflammation in the intestines, malnutrition, and steroid use all add to general risk factors like aging. For IBD patients, a DXA scan is an important screening tool.
But an extra scan for bone mineral density can be inconvenient. These patients are already juggling many appointments for this chronic gastrointestinal disease. So to compare opportunistic analysis with DXA scans, an interdisciplinary team began a retrospective study of IBD patients. The patients had all undergone both a DXA scan and a CT scan of the abdomen after consuming a liquid that helps with scan resolution. The findings were published in the American Journal of Gastroenterology and showed that the bone density measurements from the new test were similar to those from DXA, and the bone strength measurements identified additional patients who may be at high risk of fracture.
In another retrospective study, published in Radiology, CT scans of the colon and FEA were used to assess bone fracture risk in women over age 43. The findings? FEA matched DXA in sensitivity and could provide patients with a comparable assessment of osteoporosis risk.


Clinical Implementation
While Mayo Clinic is piloting the use of FEA to assess osteoporosis risk related to age and gastrointestinal disease, Dr. Keaveny thinks use of FEA could expand and prove a great convenience for patients.
Imagine turning 65. Instead of calling to schedule your bone mineral density scan, you get a call from your doctor. The doctor lets you know your bone parameters have been evaluated as part of a CT scan obtained for other reasons and what was found.
What patient wouldn’t be happy with that efficiency?
Dr. Keaveny says he hopes to fully implement FEA into widespread clinical practice before he retires because, as he says, “I’m going to need it myself.”
- Sara Tiner


