Share this:


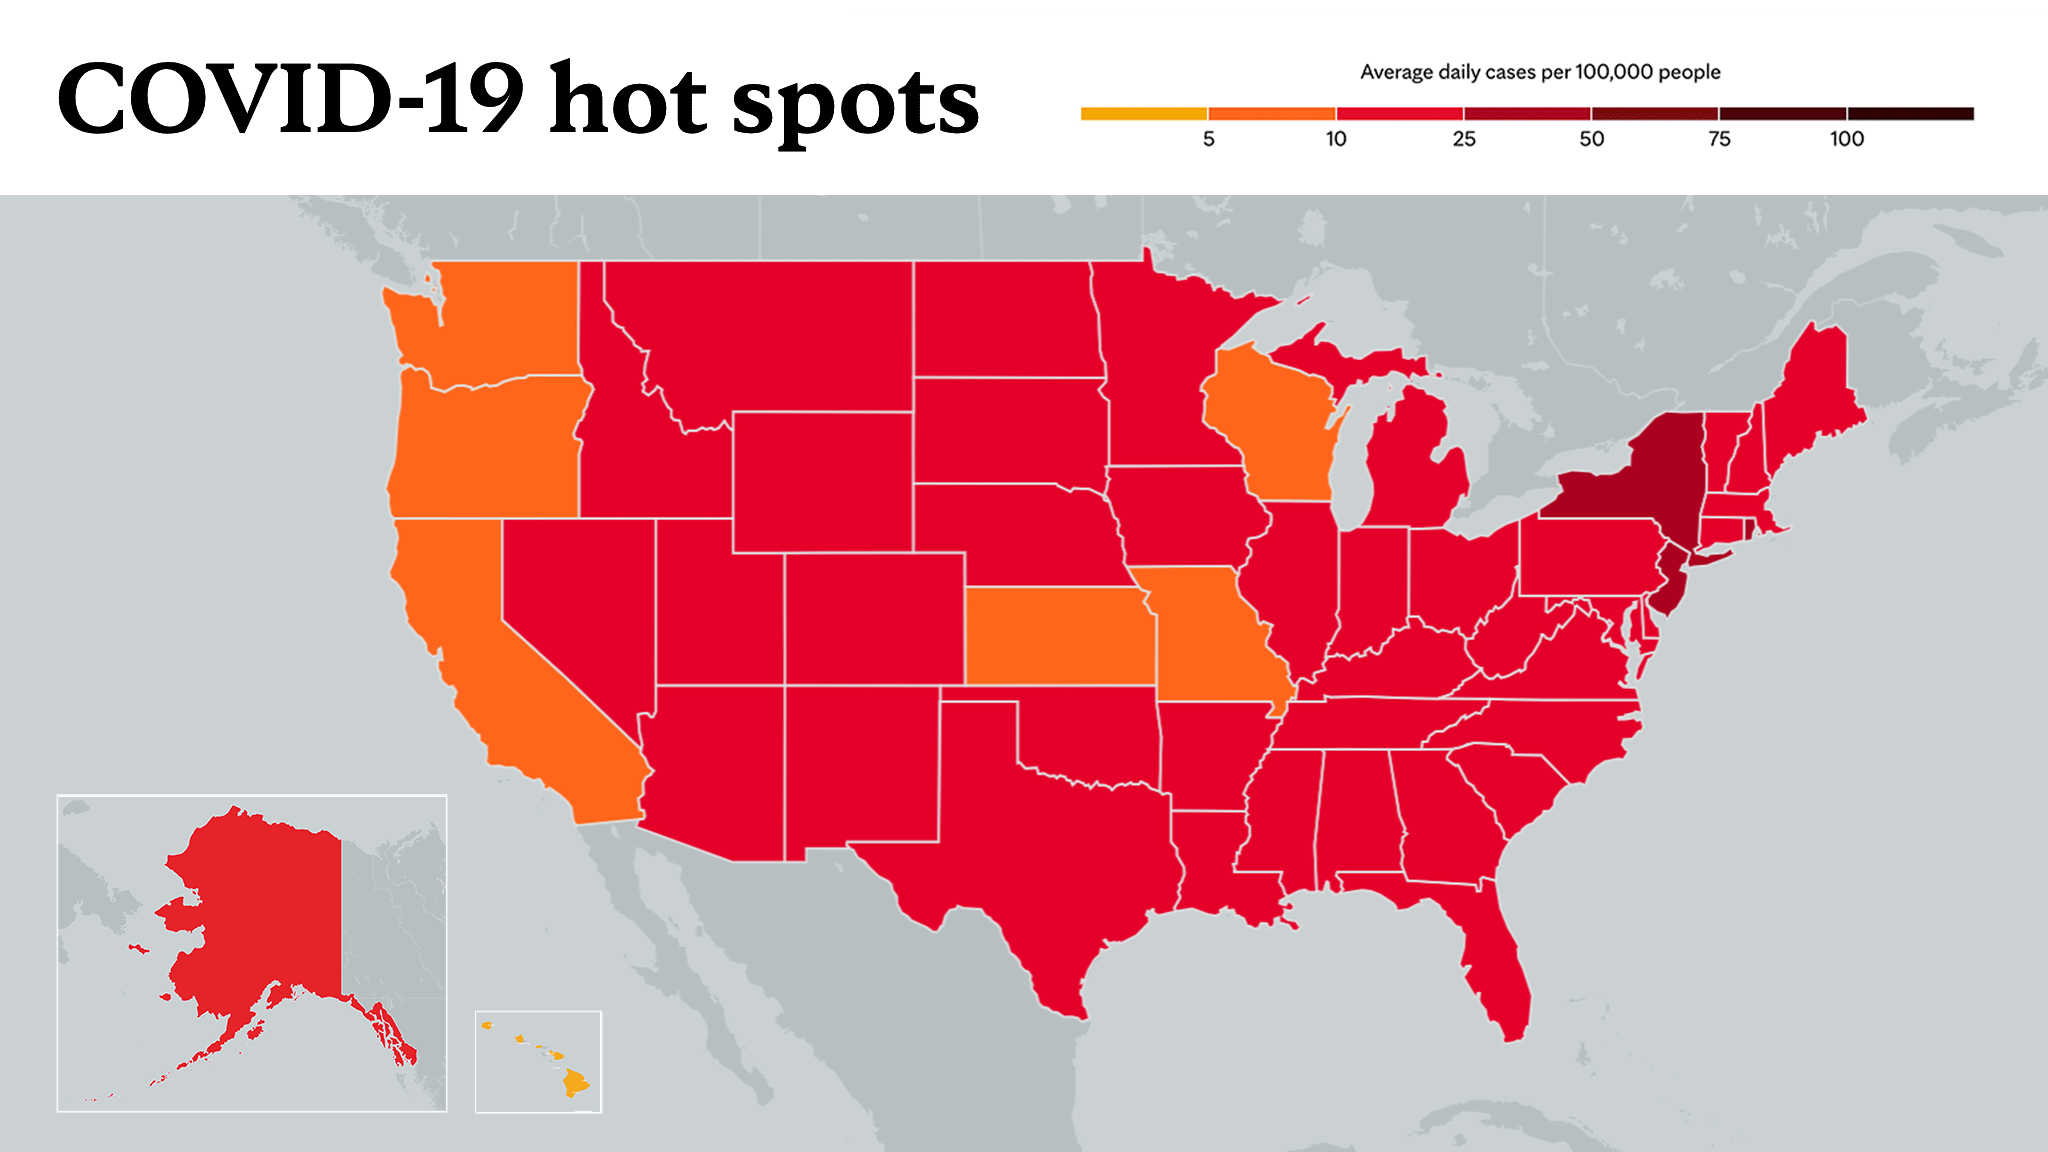
ROCHESTER, Minn. ― Mayo Clinic’s Coronavirus Map tracking tool, which has county-by-county information on COVID-19 cases and trends nationwide, now offers predictive modeling that forecasts where hot spots will emerge over the next 14 days.
The predictive modeling uses Mayo Clinic data analysis and expertise to forecast trends in COVID-19 cases and is based on modeling that Mayo Clinic has used to anticipate COVID-19 cases at its locations and to assist public health agencies. Predictive modeling is not available for Hawaii, Alaska, and U.S. territories.
Predictive modeling is among the latest enhancements to the Coronavirus Map tracking tool, which is part of Mayo Clinic’s online COVID-19 Resource Center. The tool has data and trend information for all counties in every U.S. state, the District of Columbia, and U.S. territories, and is updated daily. The Resource Center, one of the most visited websites for COVID-19 information, provides the latest data, insight on Mayo Clinic treatments and therapies, vaccines, and guidance on how to keep your family safe.
Video example below of the Coronavirus Map tracking tool.
"Mayo Clinic has made strategic investments in its digital and analytic capabilities, and this has allowed us to make precise predictions about COVID-19 cases nationwide in order to provide safe and effective care for all our patients," says Sean Dowdy, M.D., Mayo Clinic’s Midwest Quality chair. "We are now making our predictive forecasts public to raise awareness of the trends for COVID infection in specific areas nationwide."
The Centers for Disease Control and Prevention website has predictive forecasting that looks ahead for up to one month, but the information is only updated weekly. Mayo Clinic's Coronavirus Map is updated daily and is the only site with current guidance from Mayo Clinic experts.
"Among the elements that set our model apart from others are the daily data updates to improve accuracy, and the fact that it is adjusted for vaccination rates," Dr. Dowdy says.
Predictive forecasting can be especially helpful to people with family and friends in other states, and for those planning to travel. Additional design and functionality enhancements have been made to the Coronavirus Map tracking tool, which is available in English and Spanish.
Curtis Storlie, Ph.D., a Mayo Clinic data scientist who led the development of the Mayo Clinic COVID-19 forecast model, says predictive modeling has been a linchpin in Mayo Clinic’s pandemic response. "The model has been remarkably accurate, and it’s been a vital part of Mayo Clinic’s ability to manage its resources during the pandemic," Dr. Storlie says. "The model accurately predicted the different timing and the extent of the case/hospitalization surges that took place at all of our Mayo Clinic sites during the past year. This gave us time to prepare and ensure we could continue to provide the best care while keeping our patients and staff safe."
The Coronavirus Map and predictive modeling are supported by the Mayo Clinic Robert D. and Patricia E. Kern Center for the Science of Health Care Delivery.
###
About Mayo Clinic
Mayo Clinic is a nonprofit organization committed to innovation in clinical practice, education, and research, and providing compassion, expertise, and answers to everyone who needs healing. Visit the Mayo Clinic News Network for additional Mayo Clinic news.
Media contact:
- Jay Furst, Mayo Clinic Public Affairs, newsbureau@mayo.edu
________________________________________
Information in this post was accurate at the time of its posting. Due to the fluid nature of the COVID-19 pandemic, scientific understanding, along with guidelines and recommendations, may have changed since the original publication date.
For more information and all your COVID-19 coverage, go to the Mayo Clinic News Network and mayoclinic.org.
Learn more about tracking COVID-19 and COVID-19 trends.